Remote Debugging Sitecore with Visual Studio

Why is this needed?
- Can't reproduce the issue in the Sitecore instance available in developer machine
- No Visual Studio on the server (Mostly Stage and Prod)
- Additional logging hasn't helped or discrepancies between environments
- Deployment of additional logging is not allowed as we need
- Issue seen on a common or Shared Sitecore instance for developers
Pre-Requisites
Access to install or copy the Visual Studio Remote debugging tool
Execute the remote debugger service exe file
TCP Port access to connect to the service
Visual Studio version matching the debugging tool or lower version
Remote Debugging Tools
Option 1:
Download and install the remote tools on the remote server that you would like to debug. Newer remote tools versions are compatible with earlier Visual Studio versions, but earlier remote tools versions aren't compatible with later Visual Studio versions. Ensure the remote tools have the same architecture as the machine you're installing them on. Most new server installs are 64-bit.
| Visual Studio | Link |
|---|---|
| 2019 | Remote tools |
| 2017 | Remote tools |
| 2015 | Remote tools |
| 2013 | Remote tools |
Open the installer
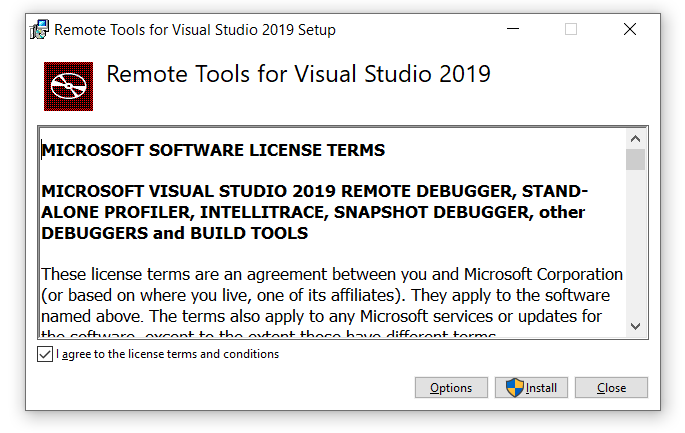
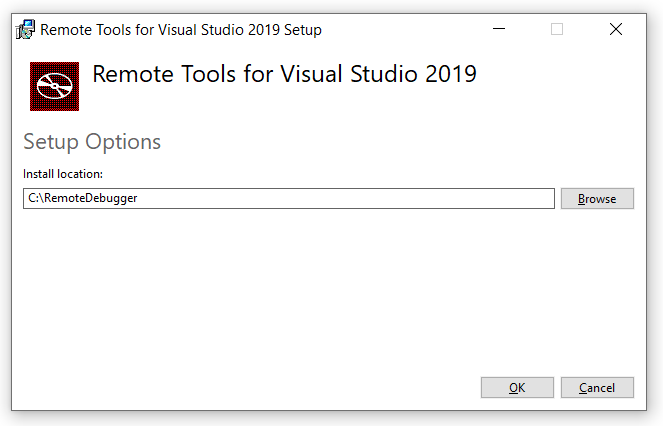
Choose option if you would like to install in a different location
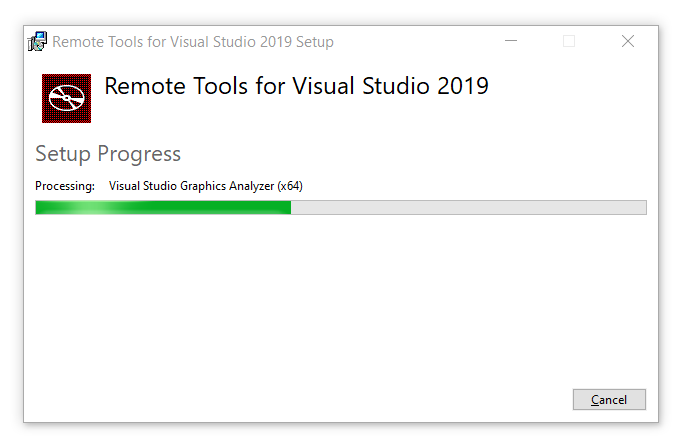
Install takes few minutes
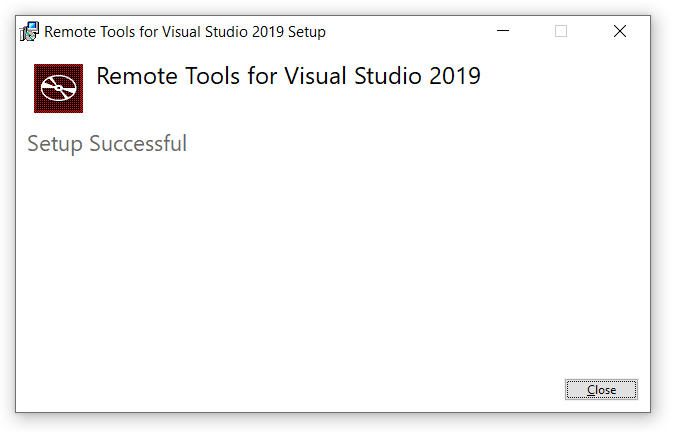
Install successfully completed
Option 2:
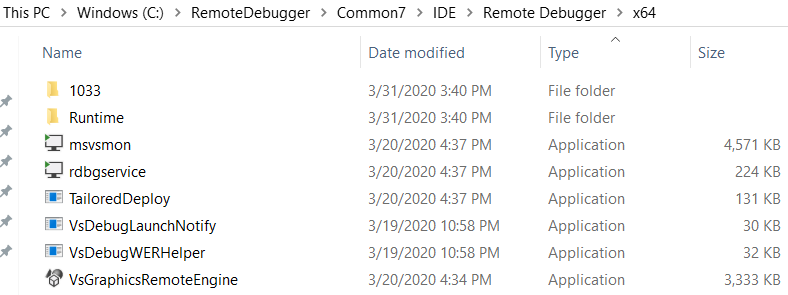
Copy the installation folder from a local install to the server we plan to debug.
The default installation folder location for 64-bit installation is as follows
"C:\Program Files\Microsoft Visual Studio 16.0\Common7\IDE\Remote Debugger\x64"
Execute Remote Debugging Tool
Open the file "msvsmon.exe" from the installation folder or the copy location on the remote server
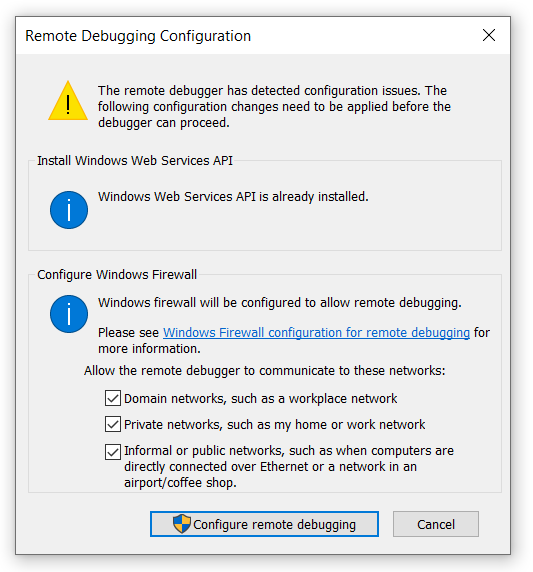
First time you open it might prompt to add the firewall exception on the port if its active.
Noe the tool should run with the following message.
Msvsmon started a new server named "server name:portnumber".Waiting for new connections
In this example server name: 002 Port number: 4024

Navigate to Tools > Options
Port
Default port for VS2019 is 4024. The port number is different for each version of Visual Studio as follows but this can be modified as per our use.
| Visual Studio | Port |
| 2019 | 4024 |
| 2017 | 4022 |
| 2015 | 4020 |
| 2013 | 4018 |
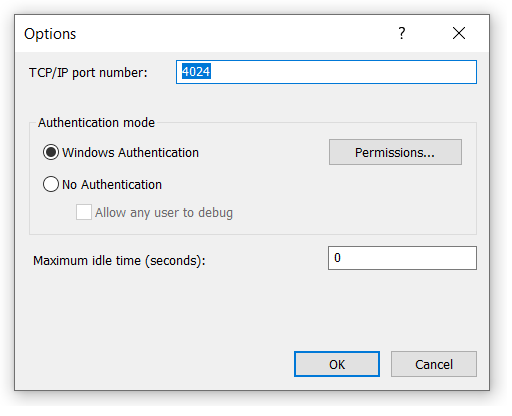
Authentication Mode:
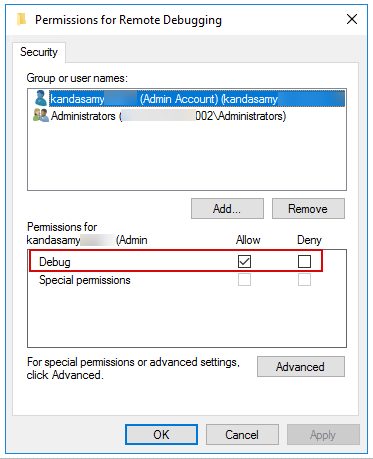
By default, the current user executing the "msvsmon.exe" will be added and provided debug accees. Administrators group will be added and provided debug allow.
The user running Visual studio should have access to the service to debug. If there is a mismatch then you could use No Authentication option, if it is a secure network but I wouldn't recommend this.
Note: The msvsmon.exe can also be configured as a service, to be always running on the server.
When minimized it will be available in the taskbar next to the clock.
Visual Studio Debugging
Enable the following settings before attaching the debugger.
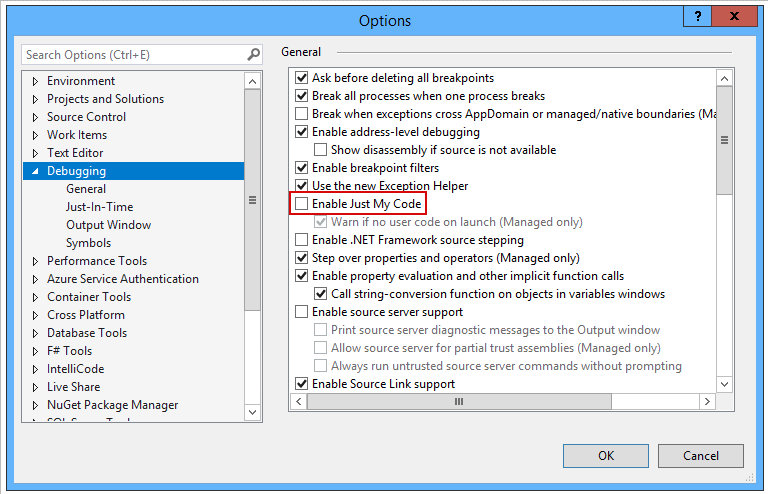
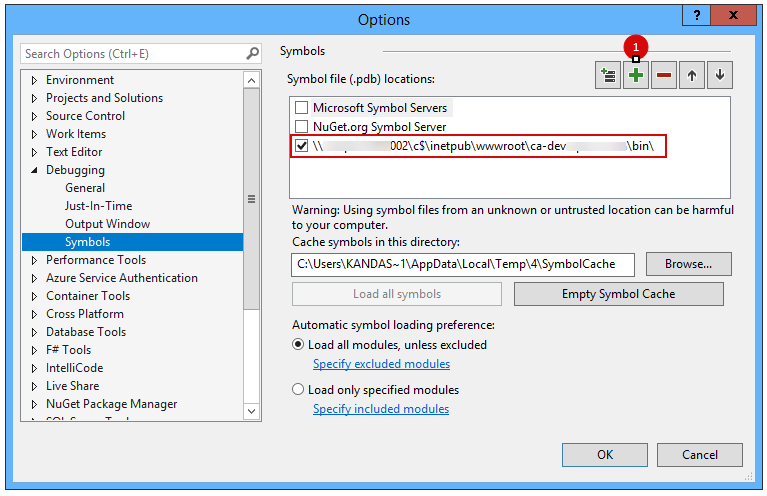
Navigate to Tools > Options > Debugging >
- General > uncheck Enable Just My Code
- Symbols > Add > Provide the file share path of the website bin folder \002\c$\inetpub\wwwroot\ca-dev\bin
Ensure the solution is built and deployed in debug mode
Attach Debugger
Navigate to Debug > Attach to Process > Connection target >Enter server name 002:4024 and hit enter it should list all the process from the remote server
Choose the Sitecore instance to debug and it should hit the break points when you browse the site.
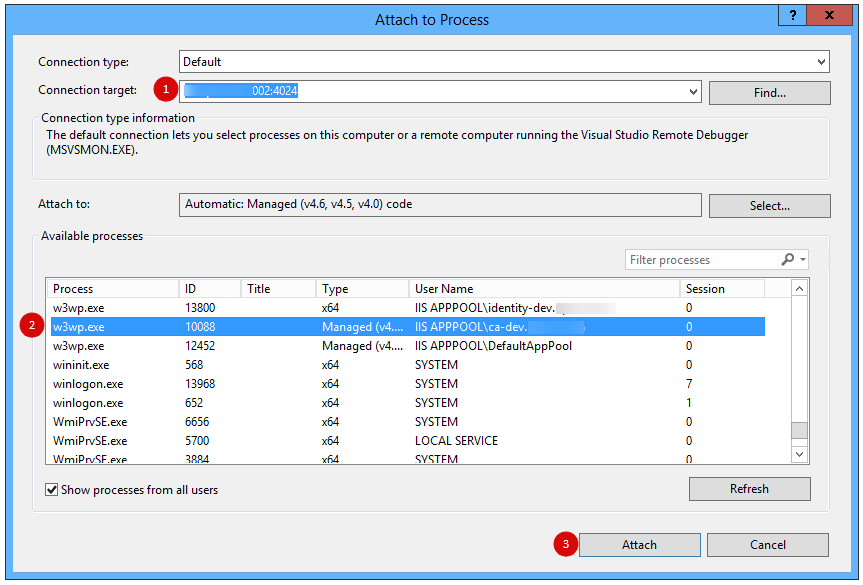
On the remote server you should see the active connections or any error occurred while connecting.

Attach Debugger on Azure
https://cloudopszone.com/configure-remote-debugging-tool-on-azure-vm/
Attach Debugger on Docker
https://intothecloud.blog/2019/09/21/Deploying-and-Debugging-Your-Visual-Studio-Solution-to-Your-Sitecore-Docker-Containers/
Issues and Solution
-
The Microsoft Visual Studio Remote Debugging Monitor (MSVSMON.EXE) does not appear to be running on the remote computer.
- Ensure the process is up and running
- Ensure the machine is reachable. Do network test by pinging the server in command prompt
- Ensure firewall is not blocking the traffic by port
- https://docs.microsoft.com/en-us/visualstudio/debugger/error-remote-debugging-monitor-msvsmon-exe-does-not-appear-to-be-running?view=vs-2019
-
The breakpoint will not be currently be hit. The symbols are not loaded from the current document
- Ensure the deployed code is build in debug more
- Ensure the .pdb files are available in the bin folder
- In the VS debug settings
- Enable Just My Code (Uncheck)
- Add symbols location
- https://stackoverflow.com/questions/151966/why-are-no-symbols-loaded-when-remote-debugging
-
Unable to connect to Microsoft Visual Studio Remote Debugger named
- Restart the msvsmon.exe
- Restart Visual Studio
Ref:
https://docs.microsoft.com/en-us/visualstudio/debugger/remote-debugging-csharp?view=vs-2019#download-and-install-the-remote-tools
https://docs.microsoft.com/en-us/visualstudio/debugger/remote-debugging?view=vs-2019
Remote debugging on Azure
https://cloudopszone.com/configure-remote-debugging-tool-on-azure-vm/
Remote debugging with Docker
https://www.konabos.com/blog/tooling-to-help-debug-your-sitecore-docker-containers
Photo by Ash Edmonds on Unsplash
